

Automation / Reporting
Your numbers. Every Monday. Automatically.
We pull data from all your tools, summarise it and send it to you, so you stop building reports by hand.
Book free audit ↗Example workflow
Live- 01Your tools
- 02Data combined
- 03AI summary
- 04Sent to Slack or email
- 05Alerts if something drops
What is reporting automation?
Reporting automation pulls the numbers from all your tools into one place and sends a short, plain-language summary on a schedule, for example every Monday morning to email or Slack. It highlights what changed and what needs attention, so nobody spends hours building the same report by hand.
Updated
The problem
Reports take hours and are outdated by Friday.
Sound familiar? This is the part we automate first.
- 01Data spread over 5 toolsSales live in one tool, invoices in another and leads in a third, so no single place shows the whole picture.
- 02Copy-paste into spreadsheetsSomeone exports from each tool every week and pastes it all into one spreadsheet. It takes half a day.
- 03Problems spotted too lateBy the time the report is ready, the week it describes is over and small problems have grown.
What we automate
What we automate in reporting.
Start with one. We build it, test it on your real data and hand it over working.
- 01
Weekly KPI summary
Your key numbers in one short message every week.
- 02
Live dashboard
One dashboard that updates itself.
- 03
Sales & marketing reports
Leads, sales and campaigns in one view.
- 04
Cash & invoice overview
See what's paid, what's due and what's late.
- 05
Alerts when numbers drop
Get a ping when a number drops below your goal.
- 06
AI written summary
A plain-language summary of what changed and why.
Example workflow
How the workflow runs.
One example of how this runs for a small team. We adapt every step to your tools.
- 01
Your tools
Numbers are pulled from the tools you already use.
- 02
Data combined
Everything is combined into one clean dataset.
- 03
AI summary
AI writes a short summary of what changed.
- 04
Sent to Slack or email
The report lands in Slack or your inbox.
- 05
Alerts if something drops
You get an alert as soon as a number drops.
Example run
Auto-report, minute by minute.
- Before
- Someone spends hours every week pulling numbers from different tools into one report.
- After
- Every Monday a short summary with your key numbers arrives in Slack or email, written in plain language.
- Good fit for
- Businesses that build the same report by hand every week. You need: access to the tools where your numbers live.
- Mon 07:00Data pulledSales, leads, orders and invoices from your tools.
- 07:01CombinedEverything lands in one sheet, the same way every week.
- 07:02AI summary writtenWhat went up, what went down, and what needs attention.
- 07:03Sent to youA short message in Slack or email.
Our work
How it looks in a business.
An example project with sample data. The same kind of system we would build for you.
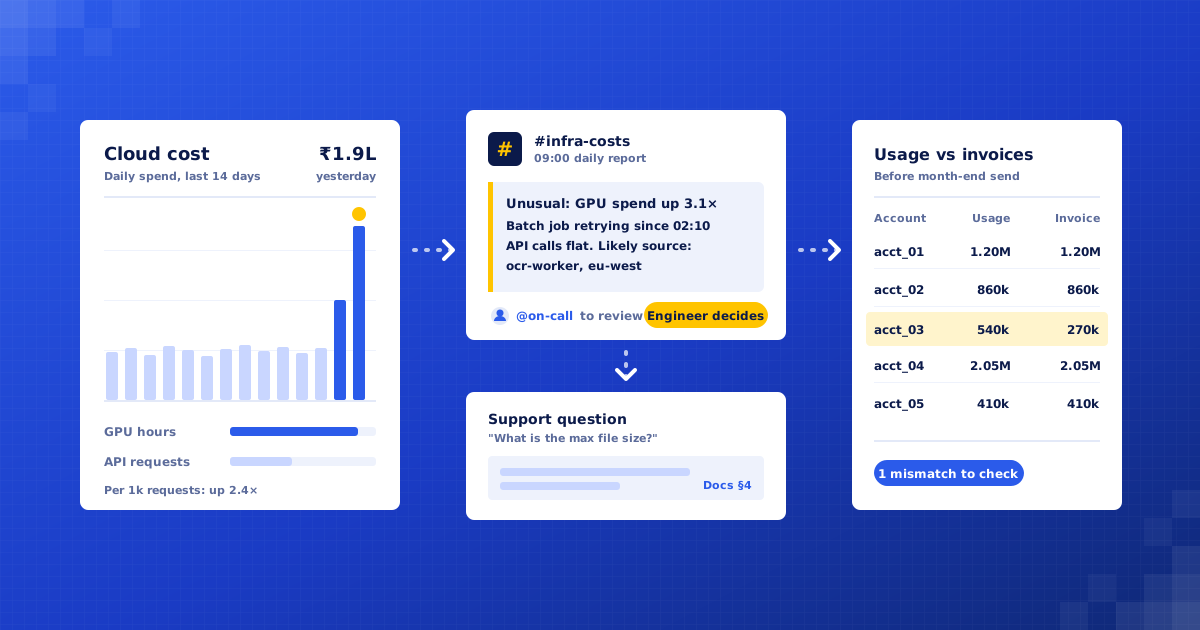
AI & Cloud
Daily cloud cost reports, usage-to-invoice checks and faster API support
Read the case study →Go further
When every case is different, use an agent.
Fixed steps suit most reporting work. When the next step needs judgement, an AI agent can look things up, decide and act, with a person approving anything risky.
See AI agents →Integrations
Works with the tools you use.
Don't see yours? We check it in the free audit.
- Google Sheets
- Looker Studio
- HubSpot
- Shopify
- Xero
- Slack
FAQ
Questions, answered.
Anything else? Ask us in the free audit.
Which numbers can you report on?
Anything your tools store: sales, leads, orders, cash, support.
Do we need a dashboard tool?
No. A weekly email or Slack message is often enough.
How often?
Daily, weekly or monthly. You choose.
Which tools can you pull data from?
Most tools with an export or an API: CRMs such as HubSpot and Zoho, Shopify, Tally, Google Sheets, ad platforms, helpdesks and your own database.
What does the weekly summary look like?
A short message in plain language: the key numbers, what went up or down compared with last week, and anything that needs attention, with a link to the full sheet or dashboard.
Can we get alerts between reports?
Yes. You set thresholds, such as sales below target or unpaid invoices over a limit, and the right person gets a message as soon as one is crossed.
Who can see the reports?
You choose who receives each report. The data stays in your own sheets and tools, and you can change recipients at any time. Different people can get different reports, for example sales numbers for the sales lead and cash for the owner.
How long does the first report take to set up?
We agree the timeline in the free audit. It depends on how many tools the numbers come from and how clean the data already is.
Do we need a dashboard tool such as Looker Studio?
Not to start. A weekly message plus one clean Google Sheet covers most needs. If you want charts, we connect the same sheet to Looker Studio, which is free.
What if our data is messy?
That is normal. The first step cleans it up: matching names that are spelt differently, removing duplicates and agreeing one definition for each number. The report then uses the clean version every week.
Can the summary explain why a number changed?
It points out what moved and where, for example which product, channel or customer drove a drop. It flags what needs attention; your team decides what to do about it.

Find your first automation in 30 minutes.
Free audit. Fixed quote after. No surprises.
Book free audit ↗